Chart Type
Wednesday, February 24, 2010
Recording of stock price can be done by Tick-by-Tick basis, where all the ticks were recorded on which trading is performed or on a TIME INTERVAL basis where 4 points (open, high, low, and close) are recorded. The later one in more popular as it requires less data storage. Different time interval is suitable for different type of trading. For a strategy where an investor buys and holds the stocks for a longer time for appreciation, daily interval is more suitable. For short-term trading a smaller interval is preferable.
On a tick by tick data, chart is made by joining the last tick value to the next tick value on the continuous basis.
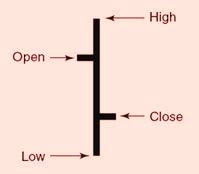
Bar chart is drawn by marking drawing a vertical line whose length is the range (High-Low) of the interval and marking the opening price on the left side and closing price on the right side of the vertical line.
Bar chart is the basis of CANDLE STICK charting, where a rectangle is drawn between open price and close price. The height of the rectangle is the difference between the two (open price and close price) and width is the time interval. A color scheme for rectangle is chosen to represent an upward or a downward movement during this time interval. Usually a white/green color is chosen for upward movement and a dark/red is chosen for downward move.
The bar-chart and hence the candle sticks offer a wide range of patterns to infer from and most of the technical analysis is based on these patterns along with volume analysis. I will write about individual patterns in detail in my later posts categorizing with trends.
Recent development in technical analysis is due to use of GRID trading systems where buying and selling order and their density can be seen on the real time basis to determine the trend in very small span of time. A large no of automated system are based on this analysis with their strategies.


 Subscribe to our News letters to get our regular updates to your email inbox...
1 comments:
Thank you for sharing such valuable and helpful information, tips and knowledge. This gives me more insights on this. I would love to see more updates from you.
Shares to Buy
Post a Comment