
Qtstalker Indicators
Saturday, December 24, 2011
Here is some of my custom indicators in qtstalker :
---------------------------------------------------------------
1. Constriction in Bollinger-band:
This indicator quantifies price movement with respect to overall range.
A higher value indicates a volatile movement in price.
Price movement within 5-15 % can be considered as normal.
A very lower range bound price movement for some days generally lead to a price breakouts which can be in either direction.
Direction can be anticipated using other indicators.
Here is the code: Its a custom indicator , so select CUS in indicator select list.
Paste the below code in CUS indicator window.
----------------------------------------------------------------
INCLUDECUS(BBconstriction)
Bol_up :=TALIB(BBANDS, Close, 10, 2, 2, 1)
Bol_dn :=TALIB(BBANDS, Close, 10, 2, 2, 3)
SMA4 := TALIB(SMA,Close,4)
Range := UTIL(SUB,Bol_up,Bol_dn)
Inprcnt :=UTIL(DIV,Range,SMA4)
Then in Plot tab select , Inprcnt and choose color for display.
-------------------------------------------------------------------
2. SMA crossover
------------------------------------------------------------------
INCLUDECUS(smacrossover)
SMA5 :=TALIB(SMA,Close,5)
SMA8 :=TALIB(SMA,Close,8)
see this indicator working along with NIFTY 50 INDEX with above parameters.
Read more...
---------------------------------------------------------------
1. Constriction in Bollinger-band:
This indicator quantifies price movement with respect to overall range.
A higher value indicates a volatile movement in price.
Price movement within 5-15 % can be considered as normal.
A very lower range bound price movement for some days generally lead to a price breakouts which can be in either direction.
Direction can be anticipated using other indicators.
Here is the code: Its a custom indicator , so select CUS in indicator select list.
Paste the below code in CUS indicator window.
----------------------------------------------------------------
INCLUDECUS(BBconstriction)
Bol_up :=TALIB(BBANDS, Close, 10, 2, 2, 1)
Bol_dn :=TALIB(BBANDS, Close, 10, 2, 2, 3)
SMA4 := TALIB(SMA,Close,4)
Range := UTIL(SUB,Bol_up,Bol_dn)
Inprcnt :=UTIL(DIV,Range,SMA4)
Then in Plot tab select , Inprcnt and choose color for display.
-------------------------------------------------------------------
2. SMA crossover
------------------------------------------------------------------
INCLUDECUS(smacrossover)
SMA5 :=TALIB(SMA,Close,5)
SMA8 :=TALIB(SMA,Close,8)
In PLOT tab select these TWO variables SMA5 and SMA8 with different color
---------------------------------------------------------------
There are so many indicators available to choose from the list and there combinations
can be even more in number and in efficacy too.
The code for these indicator can be directly used to construct custom screeners.
So along with indicators, screeners can be constructed on every combination.
--------------------------------------------------------------
3. Negative volume Index (NVI)
(Left side of := is variable name which user can choose by self.)
VOL1 :=VOL(NVI)
VAR1 :=TALIB(SMA,VOL1,20)
select these variable in PLOT tab with right choice of color
---------------------------------------------------------------
4. Positive volume index (PVI)
VOL2 :=VOL(PVI)
VAR2:=TALIB(SMA,VOL2,60)
------------------------------------------------------------
5. combining NVI AND PVI in one
INCLUDECUS(NVIplusPVI)
VOL1 :=VOL(NVI)
VAR1 :=TALIB(SMA,VOL1,60)
DIFF1 :=UTIL(SUB,VOL1,VAR1)
VOL2 :=VOL(PVI)
VAR2:=TALIB(SMA,VOL2,60)
DIFF2 :=UTIL(SUB,VOL2,VAR2)
VAR3 :=UTIL(ADD,DIFF1,DIFF2)
VAR4 :=TALIB(SMA,VAR3,40)
VAR3 and VAR4 can be plotted to predict the long term view of stock.
see this indicator working along with NIFTY 50 INDEX with above parameters.
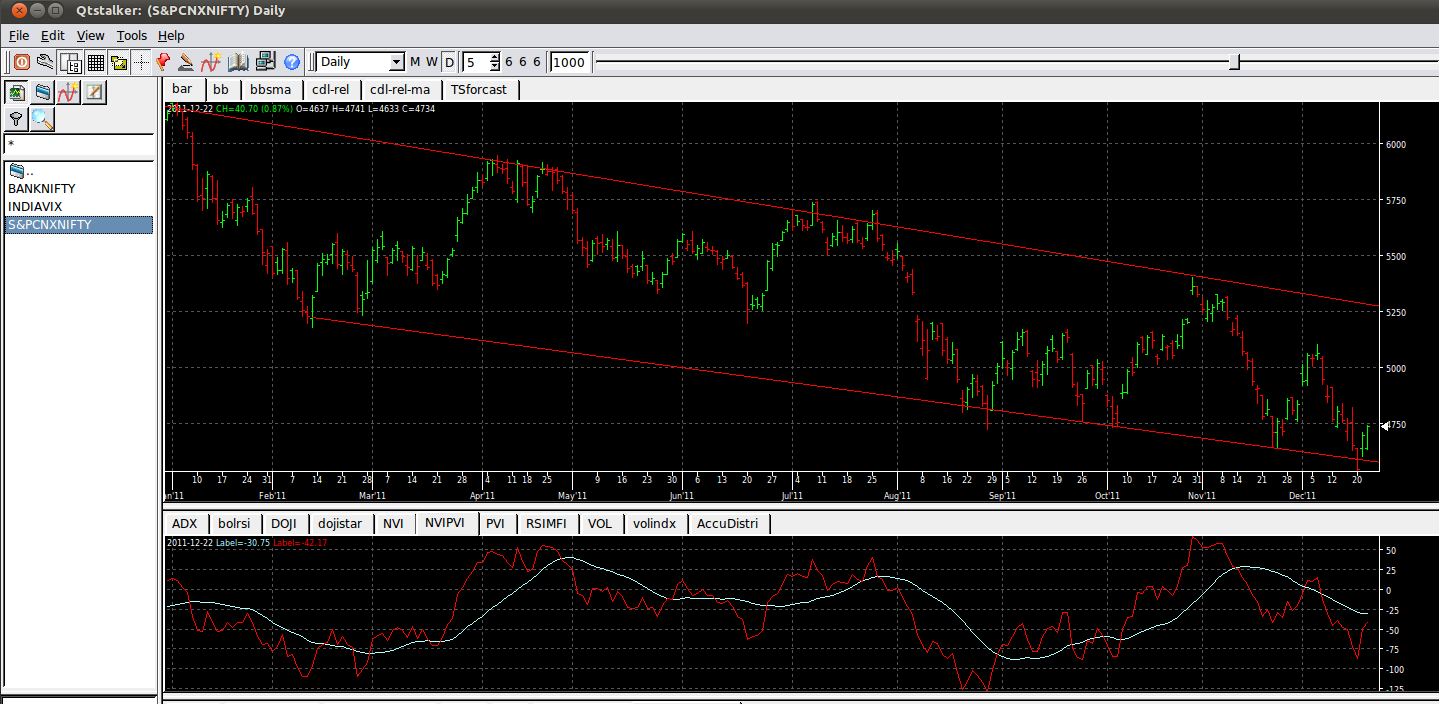 |
| NVI+PVI along with its 40 period moving average in lower TAB |
--------------------------------------------------------------
These are some of the indicators which I use to get the direction of stock.
I can create any custom indicator on qtstalker given the algorithm for same within its framework.
I hope this series on qtstalker will continue as time passes.
Any feedback and comment will be highly appreciated.


 Subscribe to our News letters to get our regular updates to your email inbox...