Index of Industrial Production

Monday, June 1, 2015

Index of Industrial Production

See the chart of  IIP  along with various sectors
  • The Eight Core Industries comprise nearly 38 % of the weight of items included in the Index of Industrial Production (IIP).
  • The different sector has corresponding weight 
  • SectorWeight
    Coal4.379
    Crude Oil5.216
    Natural Gas1.708
    Refinery Products5.939
    Fertilizers1.254
    Steel6.684
    Cement2.406
    Electricity10.316
    Overall Index37.903

Read more...

Option Strategy : Covered Call

Friday, May 30, 2014

Covered Call


where an investor holds a long position in an asset and writes (sells) call options on that same asset in an attempt to generate increased income from the asset. 


This is often employed when an investor has a short-term neutral view on the asset and for this reason hold the asset long and simultaneously have a short position via the option to generate income from the option premium.


For example, let's say I own shares of the HINDALCO and like its long-term prospects as well but feel in the shorter term the stock will likely trade relatively flat, perhaps within a few Rs up and down of its current price of, say, 150. If you sell a call option on HINDALCO for 160 Rs, you earn the premium from the option sale but cap your upside. One of three scenarios is going to play out:


  • HINDALCO shares trade flat (below the 160 Rs strike price) - the option will expire worthless and you keep the premium from the option. In this case, by using the buy-write strategy you have successfully outperformed the stock.

  • HINDALCO shares fall - the option expires worthless, you keep the premium, and again you outperform the stock.

  • HINDALCO shares rise above 160 - the option is exercised, and your upside is capped at 160 RS, plus the option premium. In this case, if the stock price goes higher than 160 Rs, plus the premium, your buy-write strategy has underperformed the HINDALCO shares.
1 lot of HINDALCO has 2000 shares ( which approximately translates into 2000 X 150 =  3 lakh Rs  investment). almost all of the lot of different stocks is in the same range. Now lets see how near month price is for different strike price of HINDALCO 
=====================
Strike price     Premium 
150                  8.55
152.5               7.15
155                  6.25
157.5               5.40
160                  4.50
=====================
At strike price of 160, which is OUT-OF-THE-MONEY, call option can be relatively safely sold and premium of 4.5 Rs, which translates into  4.5 X 2000 = 9000 Rs , from an investment of 3 lakh, which translates into 3 % monthly return (36 % annual return  Quite decent return !!!!) 

A more sophisticated investor can use future in place of stocks to implement the same strategy, but the risk involved and skill requirement is quite high. 

Source : Wikipedia


This strategy is best used when the investor would like to generate income off a long position while the market is moving sideways. It allows an investor/writer to continue a buy-and-hold strategy to make money off a stock which is currently inactive in gains. 

The investor/writer must correctly guess that the stock won't make any gains within the time frame of the option; this is best done by writing an out-of-the-money option

A covered call doesn't have as much potential for reward as other types of options, thus the risk is also low.


Time Decay


The passage of time has a positive impact on this strategy, all other things being equal.  As expiration approaches, an option tends to converge very fast on its intrinsic value, which for out-of-money calls is zero.

Main point of this strategy :
  1. It has limited profit potential.
  2. It has unlimited loss potential.
  3. Once the strategy is introduced, reduction in volatility is beneficial for this strategy.

A note of caution

As long as the short call position remains open, the investor isn't free to sell the stock. It would leave the calls uncovered and expose the investor to unlimited risk by making it a naked call.


Read more...

Qtstalker Indicators

Saturday, December 24, 2011

Here is some of my custom indicators in qtstalker :
---------------------------------------------------------------
1. Constriction in Bollinger-band:

This indicator quantifies price movement with respect to overall range.
A higher value indicates a volatile movement in price.
Price movement within 5-15 %  can be considered as normal.
A very lower range bound  price movement for some days generally lead to a price breakouts which can be  in either direction.
Direction can be anticipated using other indicators.

Here is the code:   Its a custom indicator , so select   CUS in indicator select list.
Paste the below code in CUS indicator window.
----------------------------------------------------------------

INCLUDECUS(BBconstriction)
Bol_up :=TALIB(BBANDS, Close, 10, 2, 2, 1)
Bol_dn :=TALIB(BBANDS, Close, 10, 2, 2, 3)
SMA4 := TALIB(SMA,Close,4)
Range := UTIL(SUB,Bol_up,Bol_dn)
Inprcnt :=UTIL(DIV,Range,SMA4)

Then in Plot tab select , Inprcnt and choose color for display.
-------------------------------------------------------------------

2.  SMA crossover 
------------------------------------------------------------------

INCLUDECUS(smacrossover)
SMA5 :=TALIB(SMA,Close,5)
SMA8 :=TALIB(SMA,Close,8)


In PLOT tab select  these TWO variables   SMA5  and SMA8  with different color

---------------------------------------------------------------
There are so many indicators available to choose from the list and there combinations 
can be even more in number and in efficacy too.


The code for these indicator can be directly used to construct custom screeners.
So along with indicators, screeners can be constructed on every combination.

--------------------------------------------------------------
3. Negative volume Index (NVI)

(Left side of    :=    is variable name which user can choose by self.)

VOL1 :=VOL(NVI)
VAR1 :=TALIB(SMA,VOL1,20)

select these variable in PLOT  tab  with right choice of color
---------------------------------------------------------------
4. Positive volume index (PVI)

VOL2 :=VOL(PVI)
VAR2:=TALIB(SMA,VOL2,60)

------------------------------------------------------------
5. combining NVI AND PVI  in one 

INCLUDECUS(NVIplusPVI)
VOL1 :=VOL(NVI)
VAR1 :=TALIB(SMA,VOL1,60)
DIFF1 :=UTIL(SUB,VOL1,VAR1)
VOL2 :=VOL(PVI)
VAR2:=TALIB(SMA,VOL2,60)
DIFF2 :=UTIL(SUB,VOL2,VAR2)
VAR3 :=UTIL(ADD,DIFF1,DIFF2)
VAR4 :=TALIB(SMA,VAR3,40)

VAR3 and VAR4  can be plotted to predict the long term view of stock.

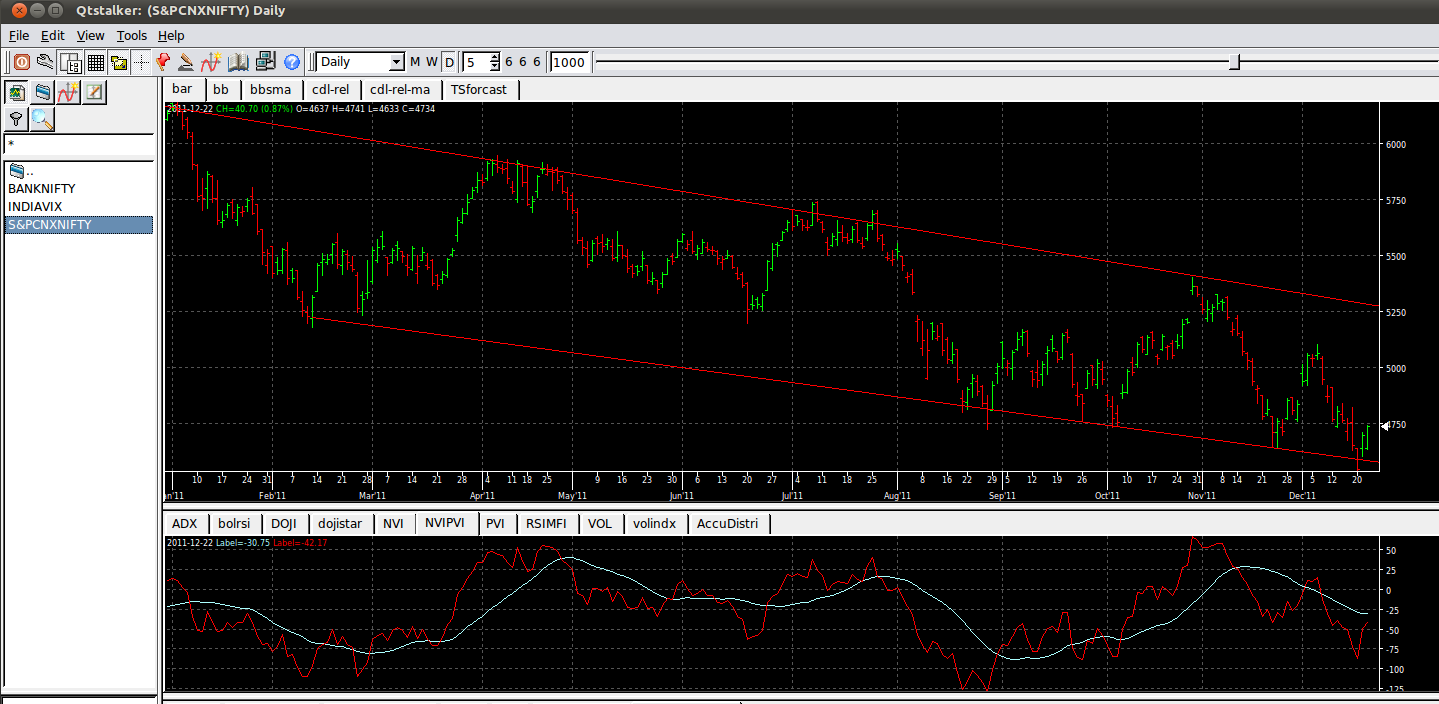
see this indicator working along with NIFTY 50 INDEX with above parameters.

NVI+PVI along with its 40 period moving average in lower TAB


--------------------------------------------------------------

These are some of the indicators which I use to get the direction of stock.
I can create any custom indicator on qtstalker given the algorithm for same within its framework.
I hope this series on qtstalker will continue as time passes.

Any feedback and comment will be highly appreciated.


Read more...

Qtstalker: A robust trade charting/analysis software in linux

Wednesday, December 21, 2011


Below text is directly taken from sourceforge website for qtstalker
I think its potential is unknown to many. I am using it with limited success for my trading activities. I will share some of my indicators and screeners which i designed using it. 

I am hoping to make a community for it .so the people out there who are using it can share there techniques to make a strong user community.

Qtstalker is a user friendly Technical Analysis package for GNU/Linux (and hence other Unix-like systems). Similar to commercial wares such as Metastock, Supercharts and Tradestation. Keeps to a lean, simple design for speed, portability, and low resource usage. Because it uses a plugin model, Qtstalker can easily be extended.
Qtstalker is 100% free software, distributed under the terms of the GNU GPL. An active development community is continually adding new features. We appreciate your input towards creating a world-class GNU/Linux TA package.

Features

  • A point-and-click object-oriented graphical user interface.
  • Chart types include line, bar and candlestick.
  • Customizable colors. Logarithmic and linear arithmetic scaling. Scale to screen.
  • Indicators plugins include MACD, MAs, Bollinger Bands, RSI, and dozens more. Provides access to the TA-Lib library of common functions.
  • A simple scripting facility to create custom indicators. This powerfully enables combination of different plots in one indicator and combining of other indicators and calculations.
  • A special indicator "ExScript" enables external scripts to pass indicator data in.
  • An "Indicator Summary" tool shows a table of all indicator parameters from all active indicators. It also writes the data to XML output for use by external programs.
  • Chart drawing objects: trendlines, buy/sell arrows, horizontal and vertical lines, fibonacci retracement lines, text and cycles.
  • Quote plugins download data from online sources such as Yahoo, CME, NYBOT.
  • Data import plugins for plain-text CSV files.
  • The "Plugin" architecture for quotes and indicators enables easy future extensibility.
  • Minute, daily, weekly and monthly chart compression options.
  • Various data classes to support for investment types such as stocks, futures, indices, ratios and spreads.
  • A back testing function allowing indicator performance tests using actual trading data.
  • A very basic portfolio manager. Good for tracking open positions. (Suggestions welcome.)
  • A Scanner that can scan the qtstalker database for charts that meet a user defined criteria.
  • A paper trading mode enabling users to practice trading without risking capital.

============================================================
MY Qtstalker screen:


I am fascinated with its library of TA indicator ( more than 150, supplied by TALIB ) which can be used with combination in custom indicators.

It has well written documentation and intuitive help for every thing. 

It has plugins for Yahoo data import and csv format (can be customized) 

My system is Dual-boot( windows7 & Ubuntu 11.04). For downloading the EOD data (nse stocks) and intraday data I use Datadownloder (volumedigger.com) .

For US stocks I have to just update it in qtstalker window itself. ( demerit : for Indian stock data data is 2 day old , means you will get Monday data on Wednesday and for Index you won't get volume data). I download NSE data from Datadownloader which take data from NSE website itself so data is in very good faith.

I am still looking like datadownloder software on ubuntu so that I dont have to do switching between linux and window.


Read more...

NIFTY moving within downward channel: 4500 ahead ?

Sunday, December 11, 2011

NIFTY is moving in downward channel since start of year 2011 and continuing the path within it. Accumulation-Distribution indicator (AD) is also moving downward along with NIFTY.

Read more...

Results till friday

Wednesday, June 1, 2011

Tue, 31st May
Board Meet :
BEML Ltd

Wed, 01st Jun
Board Meet :
Bosch Ltd
AGM :
Bosch Ltd
EGM :
ACC Ltd

Thu, 02nd Jun
Dividend :
HDFC Bank Ltd
ICICI Bank Ltd
Fri, 03rd Jun
AGM :
Reliance Industries Ltd

Read more...

Results awaited/announced

Monday, May 30, 2011

Sat, 28th May
Board Meet :
Areva T&D India Ltd
Anant Raj Industries Ltd
Hindustan Copper Ltd
Sun Pharmaceuticals Industries Ltd
IVRCL Ltd
Pipavav Shipyard Ltd
--------------------------------------------
Sun, 29th May
Board Meet :
Unitech Ltd
Tata Communications Ltd
Lanco Infratech Ltd"
--------------------------------------------
Mon, 30th May
Board Meet :
Colgate-Palmolive (India) Ltd
EIH Ltd
Hindalco Industries Ltd
India Cements Ltd
Aditya Birla Nuvo Ltd
Cummins India Ltd
Mahindra & Mahindra Ltd
Godrej Industries Ltd
Reliance Capital Ltd
Bharat Petroleum Corporation Ltd
National Aluminium Company Ltd
Shipping Corporation of India Ltd
NCC Ltd
Oil India Ltd
Central Bank of India
Oil & Natural Gas Corpn Ltd
Indian Oil Corporation Ltd
Punj Lloyd Ltd
GMR Infrastructure Ltd
Mcleod Russel India Ltd
Educomp Solutions Ltd
Reliance Communications Ltd
Dividend :
Hindustan Construction Company Ltd
Indian Bank

Read more...

Nifty outlook for 16 march

Tuesday, March 15, 2011

A further radiation threat from nuclear reactors caused almost 110 point gap down opening in Nifty today, which went further down to ~ 150 point.

Nifty recover from there and presented a perfect buying opportunity @ 10:26 AM when it crossed from lower BOLL Band to UPPER band. Exit signal from this position can be taken from falling RSI and flattening Bollinger band shape.

Nifty offered second opportunity to enter by shorting @ 2:38 PM  ~ 5480 level with RSI falling(~40) and exit around 5440 level.


Nifty 2min chart


Nifty 5 min chart

--------------------------------------------------------------------------------------------------------------------
The really big money tends to be made by investors who are right on qualitative decisions but, at least in my opinion, the more sure money tends to be made on the obvious quantitative decisions. - Warren Buffett

Read more...

Nifty Outlook for 15 march

Monday, March 14, 2011


Nifty crossed the 5500, a crucial level of resistance  decisively despite the disaster in Japan. This shows a inherent strength in Indian economy. Funds from Japanese quake sell-off might have entered on Indian bourses to give a little push which we see today. This might be short term in nature. A further 50-60 points up move which place Nifty to 5600 level can be viewed by traders as a profit booking level.

 30-min Nifty chart we can see a resistance level of 5550 and 5600 and having a supports at 5450 and 5400.

On on 5-min Nifty chart support levels come at 5500, 5480.

Nifty 2 minute chart (click on image to view large)


Nifty 5 minute chart


Nifty 30 minute char


Nifty daily chart
I don´t predict which may market will turn rather work on how it is moving.

Read more...

Buying Stocks (value investing) using financial ratio : Profitibility Analysis

Wednesday, March 9, 2011

Return On Capital Employed (ROCE):
-----------------------------------------------------------------------------------------------

ROCE measurement is more comprehensive profitability indicator because it measures management's ability to generate earnings from a company's total pool of capital. As a general thumb rule, ROCE should be greater than company's average borrowing rate to remain profitable.

Return On Equity:
-------------------------------------------------------------------------------------------


ROE ratio is an important measure of a company's earnings performance. The ROE tells common shareholders how effectively their money is being employed.  In general return on equity ratios in the 15-20% range as representing attractive levels of investment quality.

While highly regarded as a profitability indicator it does not throw light on the  disproportionate amount of debt in a company's capital structure that could translate into a smaller equity base. Thus, a small amount of net income (the numerator could still produce a high ROE off a modest equity base).


ROE must be used as a complimentary to ROCE to determine profitability. 


Profit Margin Analysis:
----------------------------------------------------------------------------------------------


Gross Profit Margin 
Total revenue from goods sold - total expense in production 


Operating Profit Margin
Gross Profit Margin - Operating Expenses (General administrative cost)

Net Profit Margin 
Simply as a company's profit margin. It is calculated after paying tax. companies use a variety of techniques to manipulate this, so, Operating Profit Margin must be used to compliment it.

--------------------------------------------------------------------------------------------

Read more...

Buying Stocks (value investing) using financial ratio : Debt Analysis

Thursday, March 3, 2011

Debt-Equity Ratio  & Debt Ratio :
------------------------------------------------------------- 
The debt-equity ratio provides company's leverage position by comparing total liabilities to shareholders' equity where as debt-ratio compares a company's total debt to its total assets,. A lower percentage means that a company is using less leverage and has a stronger equity position.


The debt-equity ratio is one of the most frequently used term in investment literature. This simple ratio provides a general indication of a company's equity-liability relationship and is helpful to investors looking for a quick take on a company's leverage. Generally, large, well-established companies can push the liability component of their balance sheet structure to higher percentages without getting into trouble.

The debt-equity ratio percentage can give  dramatic perspective on a company's leverage position than the debt ratio percentage. For example, Company A's debt ratio of 70% seems less onerous than its debt-equity ratio of 210%, which means that creditors have more than twice as much money in the company than equity holders. 
 
If the company manages to generate returns above their cost of capital, investors will benefit. However company can be easily hurt by this leverage if it is unable to generate returns above the cost of capital. Basically, any gains or losses are magnified by the use of leverage in the company's capital structure as leverage is a two edge sword.
----------------------------------------------------------------------------------------------------
Capitalization Ratio :
--------------------------------------

This ratio measures the debt component of a company's capital structure.

Long-term debt is divided by the sum of long-term debt and shareholders' equity. This ratio is considered to be one of the more meaningful of the "debt" ratios.

There is no right amount of debt. Leverage varies according to industries, line of business and its stage of development. However low debt and high equity levels in the capitalization ratio indicate investment quality.


Company's capitalization (not the market capitalization which equals No of free-float share multiplied by share price) is used to describe the composition of a company's long-term capital, which consists of both long-term debt and shareholders' equity. A low level of debt and a healthy proportion of equity in a company's capital structure is an indication of good financial health.

A highly leveraged company(high percentage of debt in caitalization) may find :

a) freedom of action restricted by its creditors 
b) have its profitability hurt by high interest costs 
c) Worst of all scenarios is having trouble meeting operating and debt               liabilities on time 

--------------------------------------------------------------------------------------------------------

Read more...

Buying Stocks (value investing) using financial ratio : Valuation Analysis -1

P/E Ratio
-------------- 

P/E Ratio = Price of share/ Earning per share (annual) of the audited result

For example, if a company is currently trading at $45 a share and earnings over the last 12 months were $2.25 per share, the P/E ratio for the stock would be 20.00 ($45/$2.25).

EPS is usually from the last four quarters (trailing P/E), but sometimes it can be taken from the estimates of earnings expected in the next four quarters (projected or forward P/E). A third variation uses the sum of the last two actual quarters and the estimates of the next two quarters.

In general, a high P/E suggests that investors are expecting higher earnings growth in the future compared to companies with a lower P/E. It's usually more useful to compare the P/E ratios of one company to other companies in the same industry, to the market in general or against the company's own historical P/E. It would not be useful for investors using the P/E ratio as a basis for their investment to compare the P/E of a technology company (high P/E) to a utility company (low P/E) as each industry has much different growth prospects.

The P/E is sometimes referred to as the "multiple", because it shows how much investors are willing to pay per dollar of earnings. If a company were currently trading at a multiple (P/E) of 20, the interpretation is that an investor is willing to pay $20 for $1 ($45 for $2.25) of  current earnings.

It is important that investors note an important problem that arises with the P/E measure, and to avoid basing a decision on this measure alone. The denominator (earnings) is based on an accounting measure of earnings that is susceptible to forms of manipulation, making the quality of the P/E only as good as the quality of the underlying earnings number.
--------------------------------------------------------------------------------------------


Price/Book value :
-----------------------

The book value of a company is an estimation of the value per share if it were to be liquidated. How much value can an investor get per share if all the assets is liquidated.
The price/book value ratio, often expressed simply as "price-to-book", provides investors a way to compare the market value, or what they are paying for each share, to a conservative measure of the value of the firm.

Formula:


If a company's share price is lower than its book value, it can indicate one of two possibilities. 
1.) The first scenario is that the stock is being undervalued by investors because of some transitory circumstance and represents an attractive buying opportunity at a bargain price. It is assumed that the company's fundamentals are intact and will eventually lift it to a much higher price level.

2.) On the other hand, if the market's low opinion and valuation of the company are correct, it will be perceived at its worst as a losing proposition and at its best as being a stagnant investment.
 

pitfalls

1.) Generally company's assets are recorded at historical cost that its book value is outdated so of limited use.
2.) Intellectual property particularly is difficult to assess in terms of value. Book value may well grossly undervalue these kinds of assets, both tangible and intangible.
The P/B ratio therefore has its shortcomings but is still widely used as a valuation metric. It is probably more relevant for use by investors looking at capital-intensive or finance-related businesses, such as banks.

-----------------------------------------------------------------------------------------

Read more...

creating online stock portfolio of nifty 50 in google finance

Wednesday, March 2, 2011

Google finance provides almost real time stock data.Nifty 50 stock on NSE niftyspark is delayed by ~ 2 min and refresh is not automatic.google data is almost real so its worth it to create nifty 50 portfolio on google. the only catch is you have to create it manual. I created it for myself. I am posting all the manual work so other don't have to go through the same.


step 1: click on portfolio
step 2: create a new portfolio
step 3: click on edit portfolio
step 4: add all the symbol list for respective portfolio in the text box and save

that's itttt!
you have created your nifty portfolio. enjoy
------------------------------------------------------------------------------------------------------
NIFTY 50
------------------------------------------------------------------------------------------------------
NSE:SUZLON NSE:MARUTI NSE:AXISBANK NSE:NTPC NSE:LT NTPC:IDFC NSE:BPCL NSE:HCLTECH NSE:HINDALCO NSE:ICICIBANK NSE:BAJAJ-AUTO NSE:RCOM NSE:TATAMOTORS NSE:SUNPHARMA NSE:DLF NSE:HDFCBANK NSE:TATASTEEL NSE:SAIL NSE:STER NSE:HDFC NSE:AMBUJACEM NSE:SESAGOA NSE:RANBAXY NSE:GAIL NSE:INFOSYSTCH NSE:BHEL NSE:SBIN NSE:PNB NSE:RELIANCE NSE:ITC NSE:RPOWER NSE:DRREDDY NSE:KOTAKBANK NSE:JINDALSTEL NSE:BHARTIARTL NSE:CIPLA NSE:HINDUNILVR NSE:HEROHONDA NSE:CAIRN NSE:ONGC NSE:RELINFRA NSE:WIPRO NSE:RELCAPITAL NSE:ACC NSE:TCS NSE:POWERGRID NSE:SIEMENS NSE:TATAPOWER NSE:BAJAJ-AUTO BOM:500520 NSE:JPASSOCIAT
-------------------------------------------------------------------------------------------------------
NIFTY MIDCAP 50


NSE:ASHOKLEY NSE:IVRCLINFRA NSE:JSWSTEEL NSE:HOTELEELA NSE:PATELENG NSE:AUROPHARMA NSE:HDIL NSE:PETRONET NSE:PUNJLLOYD NSE:MOSERBAER NSE:APIL NSE:ANDHRABANK NSE:ALBK NSE:HCC NSE:TECHM NSE:SCI NSE:MPHASIS NSE:BAJAJHIND NSE:ROLTA NSE:INDHOTEL NSE:PRAJIND NSE:IDBI NSE:VIJAYABANK NSE:NAGARCONST NSE:LUPIN NSE:SINTEX NSE:CESC NSE:TTML NSE:TATACHEM NSE:UNIPHOS NSE:BEML NSE:GESHIP NSE:MTNL NSE:INDIANB NSE:INDIACEM NSE:ULTRACEMCO NSE:LITL NSE:DIVISLAB NSE:CHENNPETRO NSE:SYNDIBANK NSE:TITAN NSE:OFSS NSE:TATAGLOBAL NSE:GVKPIL NSE:EDUCOMP NSE:CUMMINSIND NSE:WELCORP NSE:VOLTAS NSE:PIRHEALTH NSE:STERLINBIO


----------------------------------------------------------------------------------------------------
BANKNIFTY

NSE:AXISBANK NSE:ICICIBANK NSE:BANKINDIA NSE:ORIENTBANK NSE:HDFCBANK NSE:IDBI NSE:UNIONBANK NSE:SBIN NSE:PNB NSE:KOTAKBANK NSE:BANKBARODA NSE:CANBK
----------------------------------------------------------------------------------------------------

** The stocks in nifty index keep changing as NSE review it regularly so small correction is needed time to time

Read more...

Purchase stock for long term using "Nifty P/E ratio"

Monday, February 28, 2011

Statistical Features:


S.Quantity
P/E
P/B
Div.Y
Max
28.47
6.55
3.18
Min
10.68
1.92
0.59
SD
3.8
0.98
0.5
P95
24.92
5.42
2.48
P75
21.06
4.34
1.8
P25
14.89
292
1.09
Mean
18.3
3.7
1.485

The approximated linear fit for the P/E ratio has been drawn on the P/E graph. The linear equation for the above drawn line is:

                                       Y=A+BX, Err(A)=127,  Err(B)=5.2E-5

                                       Y= -1850+0.000762 X

A positive sloping Linear fit for P/E  translate into a rising P/E of Nifty over the year. The slope translate into increase in P/E  to a vale of (0.000762 x 365  = 0.278) per year.

P75 (75 percentile ) of 21.06  of P/E means 25% of time nifty-P/E ratio is above 21.06 and with average value of P/E at 18.3 it is good to go for value investing at 18-20 level or below (with current value ~20.3 can be said a good entry level)

Other important point to be taken from the chart is converging and diverging charts of P/B and Div. Yield of Nifty. A converging charts (at bottom) leads to fall in P/E value which generally leads to fall in Nifty and opposite happens when charts diverge.

As of now (25 Feb 2011) the P/E value approximately is touching the linear fit line. so Below this line buying can be said as value investing.

P/E is a lagging indicator. The denominator is earning-per-share of last audited result.Most quarterly result comes unaudited so generally annual result is taken that's why its value changes over a period of time. Its historical value can be used to make an informed and on time decision about entry and exit for long term investing in stock market.

Read more...

Nifty and Dollar-index relationship

Friday, December 3, 2010

Reference: financial chronicle
"Rising dollar index is  a factor that leads to correction in the market"

The inverse relationship between the international dollar index and Indian equities market benchmark indices, which had weakened considerably in the first half of this financial year, has once again got restored in the past five months between July and November. (see chart in left-side block)

Since July 1, and till November 30, the correlation between dollar index and S&P CNX Nifty stood firm at -0.92, which means for every one per cent rise in dollar index, Nifty fell 0.92 per cent and for every one per cent rise in Nifty, dollar index fell 0.92 per cent.

In the first half of the year from January to June, however, there was almost no relationship between dollar index and Nifty, as the correlation was a positive 0.01, which means either side movement of dollar index had failed to influence domestic market during January to June 2010.

An FCRB analysis on past several six-month periods showed that Nifty has attained such a high inverse relationship with dollar index has occurred after two and a half years.

During the half-year ended December 2007, the dollar index and Nifty held same correlation at -0.92.

Since then, the correlation between the two kept on declining until first half of this calendar year, when this relationship totally broke for a short period. During Jan-June 2008 period, the relationship was similarly broken when there was a positive 0.67 correlation between the two.

The dollar index is a measure of the US dollar relative to six global currencies —euro, yen, pound sterling, Canadian dollar, Swedish krona and Swiss franc. It appreciates when the dollar strengthens against these currencies.

Read more...

5 important Trend reversal pattern

Sunday, November 21, 2010

Head and Shoulders pattern is one of the most classic patterns in a technical analysis.


This three-peak formation is named for its resemblance to a head and two shoulders. The center peak (head) protrudes above the remaining two peaks (shoulders), which are set at or close to identical levels. The common line of support for all three peaks is known as the Neckline, which does not have to be a horizontal line. The final downward penetration of the neckline confirms the start of a new downward trend.
A real example which has formed on NIFTY daily chart is below

Inverse Head and Shoulder pattern follows the same model.


Double top is formed when the price of a pair in an uptrend rises and encounters resistance. Following this, price retreats to a support level which will become the neckline and subsequently returns to the resistance level. After failing to break the resistance level a second time the pair falls back down. At the neckline price breaks down into a new downward trend. 


The same but opposite scenario occurs in the case of a double bottom. A downtrend reverses after testing a certain support level twice. Failing to breakthrough, price reverses into a new uptrend


In the typical triple top formation each one of the heads is about the same size. A line of resistance can be drawn connecting the three tops. A neckline should be drawn connecting the support levels. After the third head, price falls below the neckline. The market may rebound for a short attempt at breaking back past the neckline only to be followed by the start of a new downward trend.

Read more...

Downloading 2 min, 5 min Nifty or stock data for free

Monday, September 27, 2010

The national stock exchange opens at 9:00 AM and closes at 3:30 PM (IST) on any trading day. This converts to total of 390 minutes of trading period. Most of our trading strategy is generally based on EOD data for long term trading but for short term and intraday trading we need the the historical data in different time interval such as 2 min, 5 min, 10 min,15 min,30 min data to back test our trading strategy.

so, how can we get free data of all these interval (2,  5,  10,  15,  30, or any custom interval)?
These data are really costly if we buy it from any data vendor. since tick-by-tick data size is very big and difficult to maintain even vendors like Quote center take a 5 sec snapshot of the data for their distribution and that too is available for 2-3 month. only program trading needs that kind of data access. For other strategies intervals mentioned above are sufficient.Below I am going to show you how to get 2 min data for any stock or index for last 30 days from google finance.

http://www.google.com/finance/getprices?q=SUZLON&x=NSE&i=120&p=2d&f=d,c,o,h,l

Utilizing the getprices function we can fetch the data from google finance according to our need.
All the parameters used in the link are quite obvious.you can read my earlier post to know it in detail.

Here, I will focus on how to get 2 min and 5 min data  for last 1 day , 2 days , 30 day.
-------------------------------------------------------------------------------
Getting 2 min data for today (or last trading day)

1. put q= your STOCK SYMBOL (in google finance)in CAPITAL LETTER
       i=120  : for  2 min dat , 300 for 5 min data
       p=1     : or 2 or put 1000 or any big number >100 to get all the data   
                   available (max 30 days data can be obtained using this)

so we have a total 330/2 =195 data for 2 min interval. On entering the above parameters in the link you will get around 195-205 data. At closing some extra data points are taken. how does the out put look like ?

EXCHANGE%3DNSE
MARKET_OPEN_MINUTE=540
MARKET_CLOSE_MINUTE=930
INTERVAL=120
COLUMNS=DATE,CLOSE,HIGH,LOW,OPEN
DATA=
TIMEZONE_OFFSET=330

a1285299120,53.85,54.2,53.6,53.8
1,53.75,53.9,53.7,53.85
2,53.7,53.8,53.65,53.75
3,54,54.1,53.75,53.75
4,54.15,54.2,54,54
5,54.25,54.35,54.1,54.1
6,54.15,54.25,54.1,54.25
7,54.1,54.2,54.05,54.2
8,54.1,54.2,54.05,54.05
...
...
...

195,54.2,54.2,54.2,54.2
199,54.35,54.35,54.35,54.35
205,54.35,54.35,54.35,54.35
206,54.35,54.35,54.35,54.35
207,54.35,54.35,54.35,54.35
208,54.35,54.35,54.35,54.35
209,54.35,54.35,54.35,54.35

first column is showing the column No and others are respective data.
a1285299120   is a time stamp.
this file can easily be copied and saved in a spread sheet and can be converted to csv file.
-------------------------------------------------------------------------

Read more...

Investing in stock market? make sure you read these.

Sunday, September 26, 2010

There are two kind of person,who , operate in the stock market. One with little or no experience but lot of expectation and no strategy  and other with experience gained through knowledge and self correction over years. It is a wise saying in the stock trading community that at the end of the day both exchange their assets and go home. With former gaining or learning a meaningful lesson with the expense of his money and later taking the money for his experience and expertise.
So, how can a newbie in the stock market reduce his learning curve and make it more steeper ? How a normal and small investor could make a consistent gain without fear of losing his capital ? How much a investor should invest, what should be his risk profile, depending on it where should he put his money--- I will try to answer these generic questions in my articles here on this blog so explore it and try to whet your skills of investing with additional insight.


Before jumping  into the ring, you must  know your risk profile. Each person has unique environment and responsibilities. so, risk profile is also unique to individuals. Personal risk tolerance may be quite different for different genders. Men are generally comfortable with high risk handling but with additional responsibilities of their family their risk profile changes to less riskier. There are several factors, which determine one's risk profile, such as :

1. Age
2. Current level of income and asset
3. knowledge and experience
4. Family situation
5. Major future events

All of these factors determine your risk profile. All these above factors can be summarize in on line " How much you can afford to lose at this point of time? "
Will it change the your living condition if you lose all of it?

If you want to measure your accurate RISK PROFILE free of cost ,click on the link. It will take around 30 minute to answer all the question and it is worth while.


Now i know my risk profile ? what next.....

The next step is familiarization of some basic financial terms. I will suggest you to visit NSE (National Stock Exchange ) website and explore as much as you can. For basic understanding of Indian financial market READ THIS.

Read more...

F 'n' O Indicators

Wednesday, September 22, 2010


Trends in the F&O can reveal broader trends in the cash market that can be used while transacting in equities. Investors can look at various parameters and ratios to gauge the mood of the market and determine in the investment strategy. F&O numbers give a hint about the short-term market movement. A note of caution: investors should use the F&O trends as one of the tools in the decision-making process and not completely rely on them for investment calls.
 This is because the liquidity or trading is concentrated in the Nifty index and in 20-25 stocks in the F&O segment. Liquidity is necessary for better price discovery. A few stocks go without trading for many days.
Among index futures, the Nifty futures account for over 90% of trading. Around 250 stocks are traded regularly in the futures segment. The top 10 contracts contribute to over 35% of the total traded volume in individual stocks in the futures segment. In the option section  Nifty options comprise around 98% of trading in options. Of the 265 stocks eligible for the derivatives trading, less than 100 stocks are traded regularly in the options segment. The top 10 stocks account for over one-third of trading in the options market. Stock futures are more liquid than stock options. Thus, investors have to ensure that the stocks they are examining in the F&O segment have good volume to decipher the trend in the cash market. So now let's move to F 'n' O Indicators.  


Premium or discount to the cash market:

First, inspect if the stocks or indices are trading at a premium or discount in the derivatives market compared with their underlying to predict whether the market mood is bullish, bearish or indecisive. Suppose stock futures or index futures are trading at a premium compared with the underlying stock or index. This points to a bullish trend in the cash market. But a stock or an index trading at a discount in the futures market indicates a bearish market.Investors can also look at the quantum of premium/discount to the spot market.

 Quantum of premium or discount 

To understand the magnitude of the bullishness or bearishness. If a particular index is trading continuously at a premium, it would indicate buoyant market sentiments. However, if the premium turns negative (discount) to the underlying stock or index, it would mean the stock or the market is weakening or likely to weaken in future. 
But care must be taken when considering the dividend on stocks. 
Future price will be in discount if there is a dividend EX date announced in that particular month. Then the Future price is equal to Cash price minus dividend amount. That means future price is lesser than cash price which does not mean that stock is bearish.  

Put-call ratio: 

This ratio is also known as the put-call volume ratio. It is widely used to understand the sentiments prevailing in the cash market. The put-call ratio is calculated by dividing the daily or weekly traded volume of put options by the daily or weekly traded volume of call options. This ratio is not only easy to calculate but also simple to interpret. Higher the number of call options traded higher are the chances of the market turning bullish in future. If put options are more popular, bears could dominate the market.
An increasing ratio over a period of time means investors are putting more money in put options, implying the broad market outlook is bearish. Thus, the market can be expected to move south or witness a sell-off.This could also be the case of investors trying to hedge their portfolios. On the other hand, a declining put-call ratio indicates investors are showing more interest in buying call options and the market is likely to move up in the near future.
 Extreme values point to a trend reversal in the coming days. This can also be termed as a contrarian indicator. An increase in the ratio to unjustifiably high levels is considered a buying opportunity as traders start covering their short positions. On the contrary, too many call options or a low put-call volume ratio signifies the market has reached an overbought level and a correction is likely. In short, a very high put-call ratio indicates the bear phase is likely to end, while a very low ratio means bulls could lose the grip over the market and a market correction is likely.  
Put-call open-interest ratio:
The put-call open-interest ratio is also one of the key indicators of possible futures movement in the spot market. The put-call open-interest ratio is calculated by dividing the total open interest of put options by the total open interest of call options. For instance, if the open interest for put options is nine and the same figure for the call options is 10, the put-call open-interest ratio would be 0.90. A put-call open-interest ratio of more than one means put options have a higher open interest compared with the call options and, thus, the future price trend is likely to be bearish. A low put-call open-interest ratio means bullish sentiments are likely to continue in future. Investors can monitor periodical changes in the put-call open-interest ratio to gauge future market outlook.
The daily Put/Call ratio can be found out by clicking the link and then accessing the data  for current month of the year.

Daily volatility:

Investors prefers a bullish market and perceive it safe as well. On the contrary, a bearish market is considered risky. Therefore, increase in daily volatility is considered bearish, while lower or moderate volatility is taken as a sign of a bullish market. Daily volatility represents volatility of the future contracts on a particular underlying stock or index. These figures are available on the NSE website. India VIX represent the daily volatility on overall market on the NSE.
The daily India VIX data can be found out by clicking on the link.

Rollover:  

The near-month F&O contract expires on the last Thursday of the month. At the time of expiry or close to expiry, investors will find news articles discussing rollover. Rollover is applicable to future contracts and not options. If an investor is holding a position in futures, he will close his position in the near month or in the current month and take a fresh position in the next-month contract. Rollover helps investors to carry his position for a longer period of time. The investor will find the Nifty futures with expiry in next month at a slight premium. he will have to bear the difference. Further, the investor will have to bear transaction-related expenses such as brokerage.
The percentage of outstanding positions rolled over to the next month is used to gauge market sentiments. A higher percentage of rollover symbolises bullish undertone, while a lower rollover indicates bearishness. It is difficult to comment on the market mood by just looking at the rollover figures. Investors have to use other numbers to deduce the right conclusion. Every buy side has a sell side to it. As a rule of thumb, if the market is in a bull phase, a high percentage of rollover could mean the market would remain firm or move up in the near future. In an extremely bearish market, a high rollover could spell trouble as it could denote that the bears are convinced the market would fall in the future.
Open interest and change in open interest: 

Open interest in the F&O market along with price movement and traded volume is also used by traders to predict future trends. Open interest is basically the total number contracts — futures or options — that remain open at the end of the day. 
Don't get confused with open interest and volume of trade. Volume of trade and open interest are different. Volume is total no of transacted contract for the day and open interest is total number of contract (buy) that still needs to be closed by going opposite transaction.


Read more...

Back to TOP